Data Resumes
20+ Statistical Analyst Resume Examples
Customize any of these resumes in minutes using our free AI-powered resume builder.
“Rezi is super upfront and continues to improve over time. I've recommended Rezi to several of my friends and colleagues. I just love this product so much.”

Ricky M.
Software Engineer
“Rezi is super upfront and continues to improve over time. I've recommended Rezi to several of my friends and colleagues. I just love this product so much.”
Ricky M.
Software Engineer
Helping users land jobs at 1,000+ companies such as


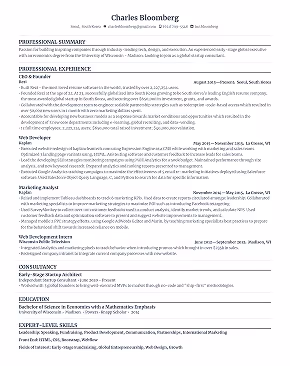
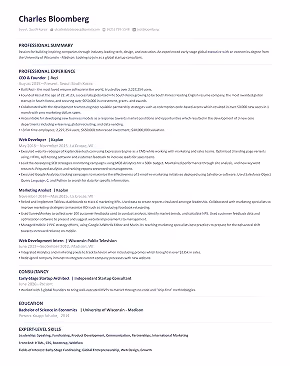
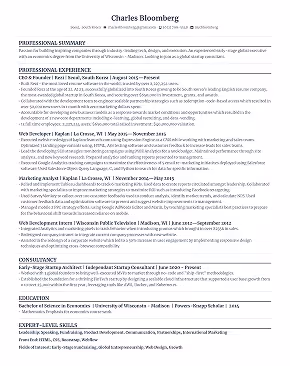
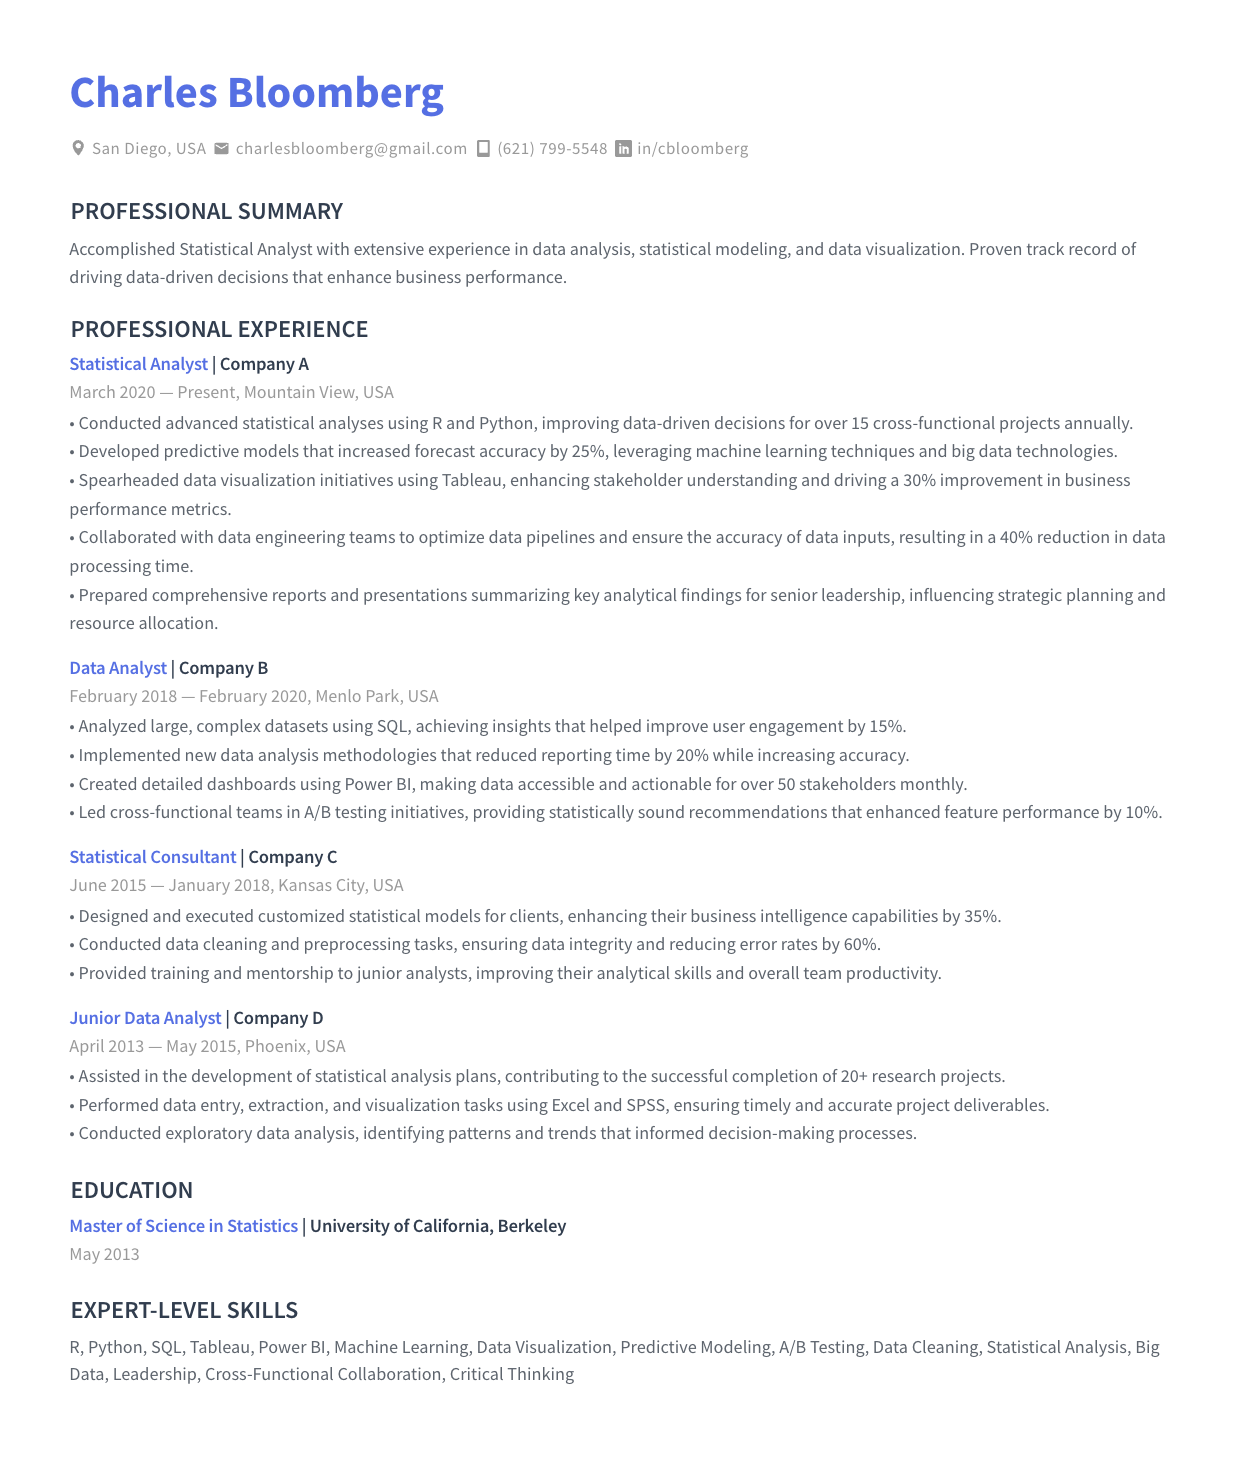
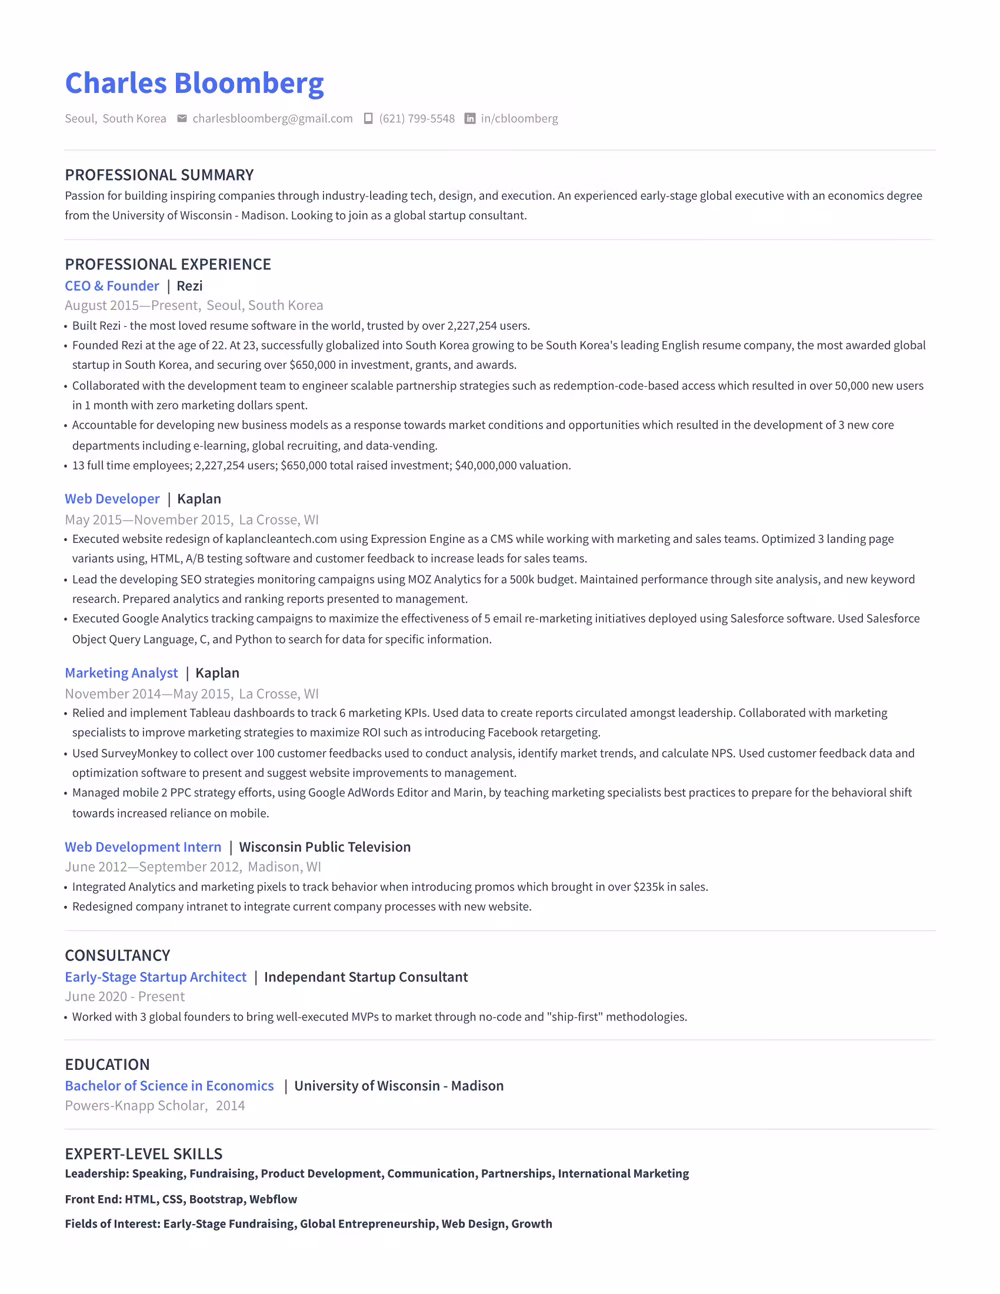
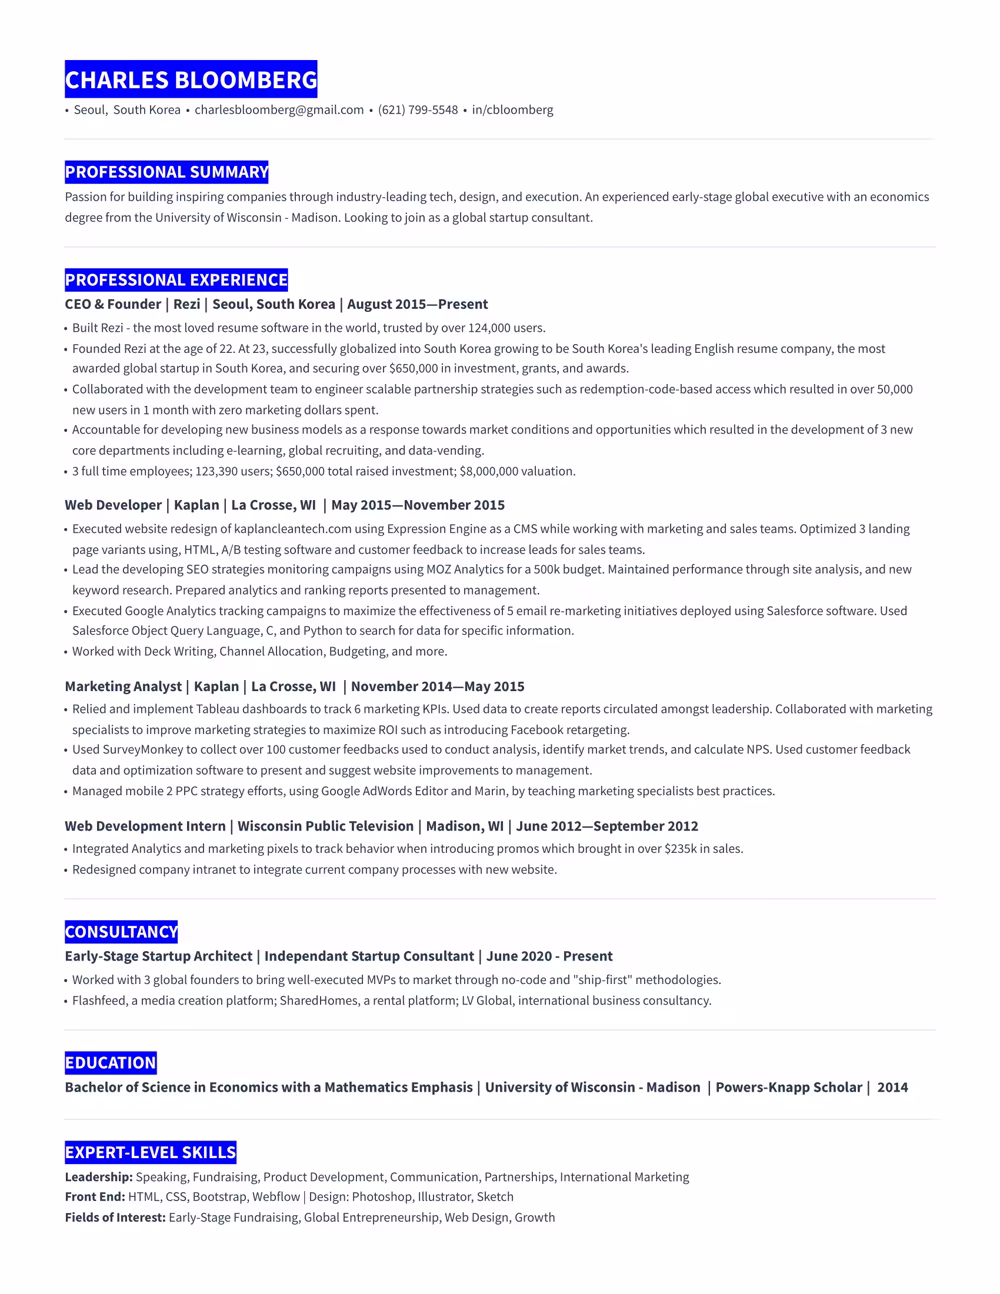
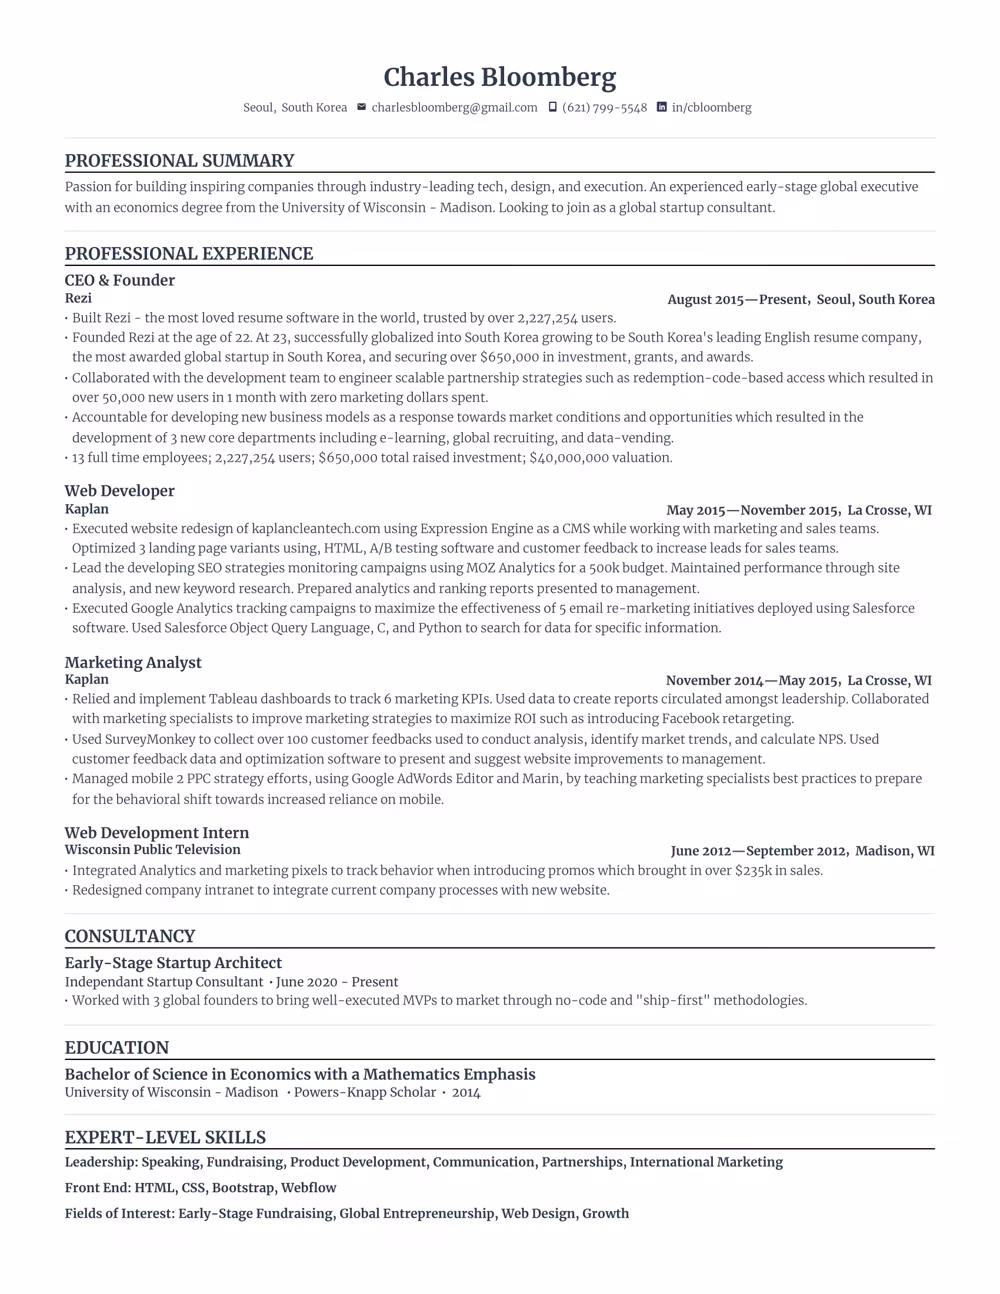
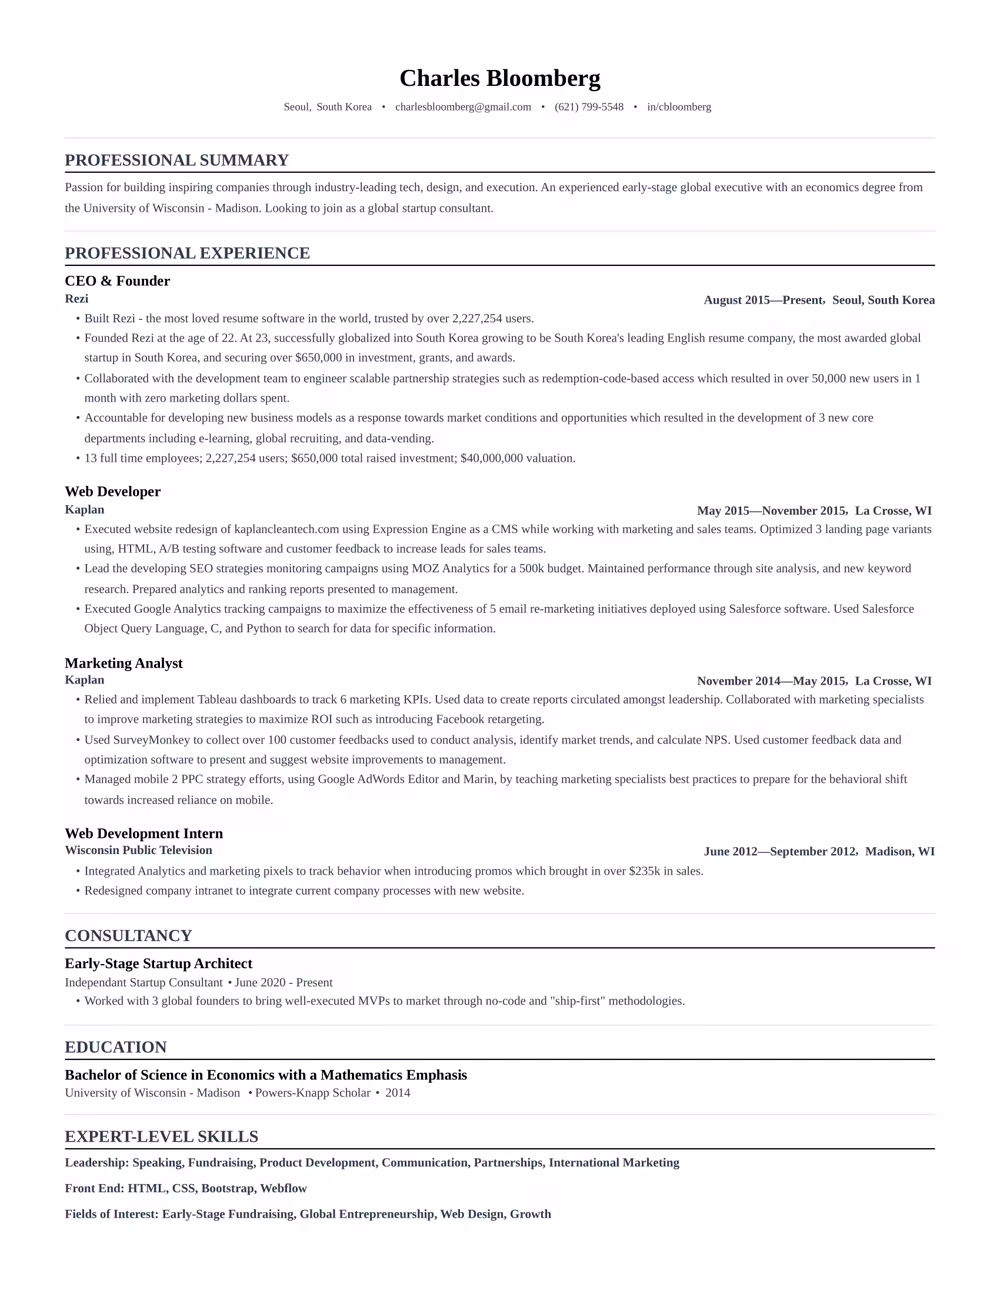
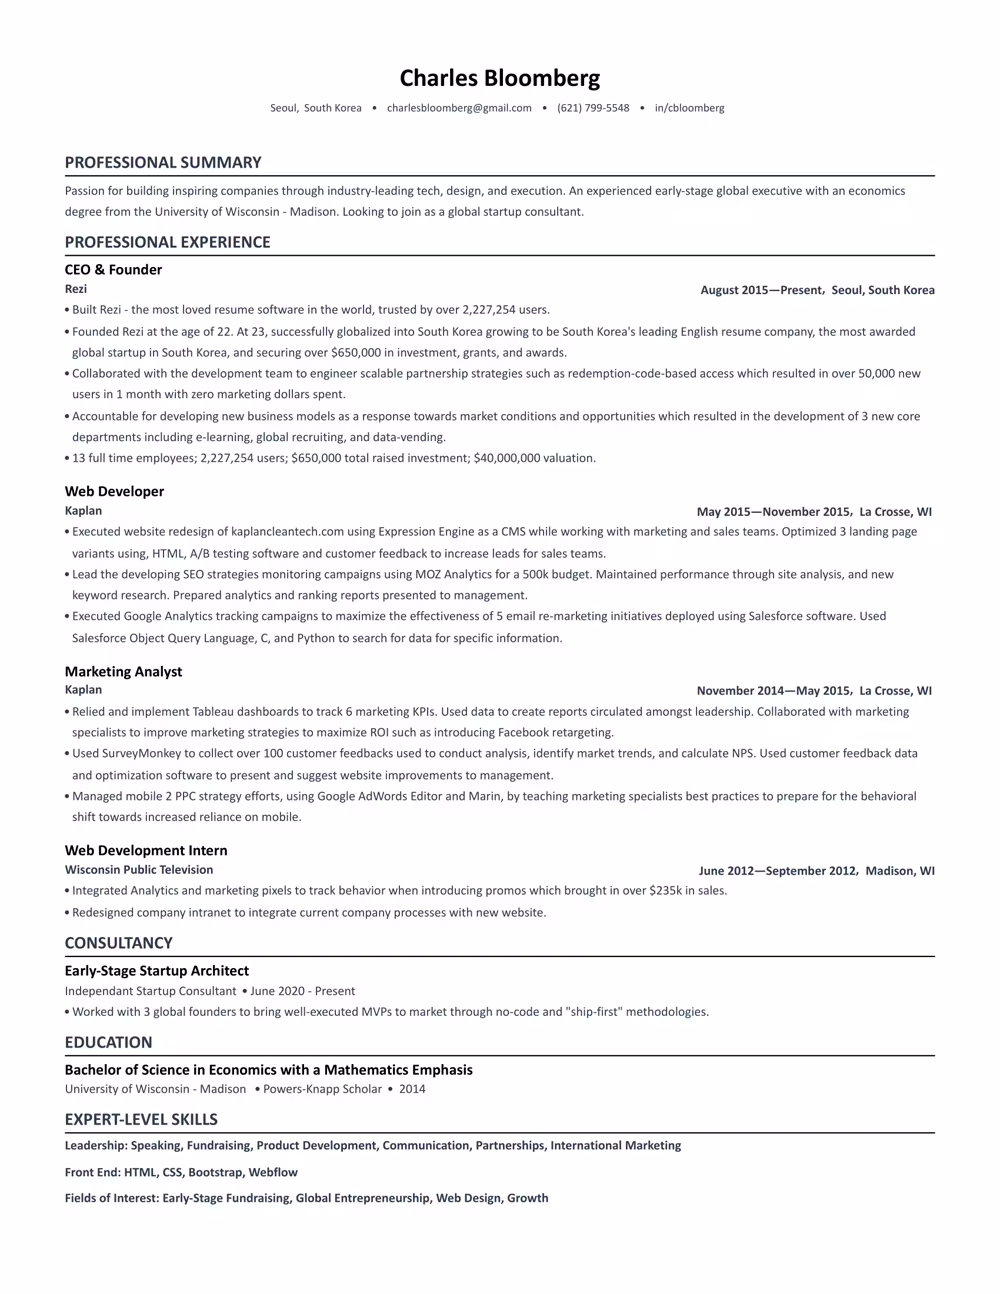
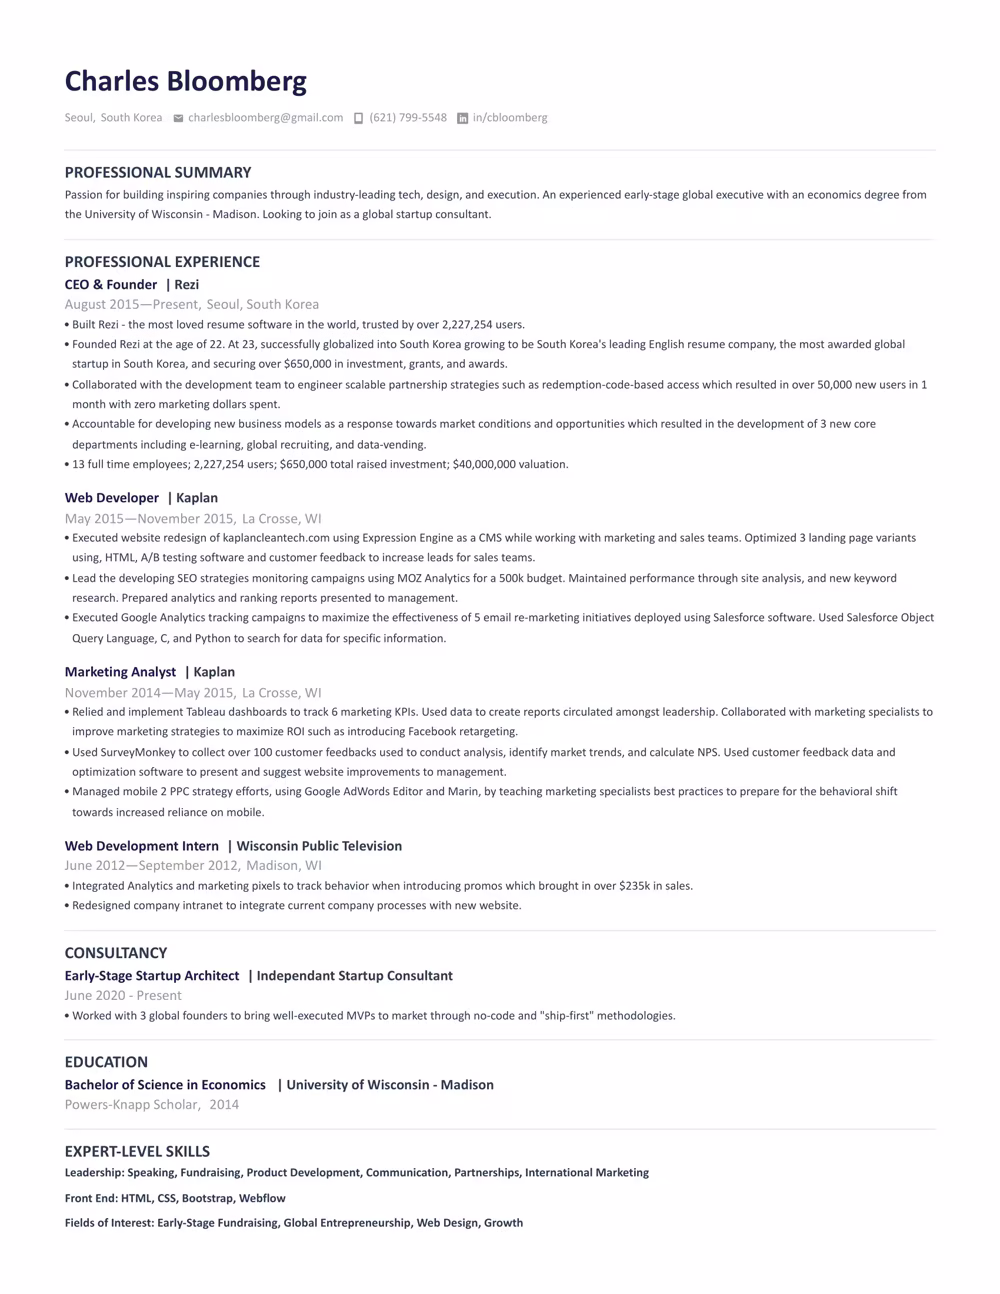
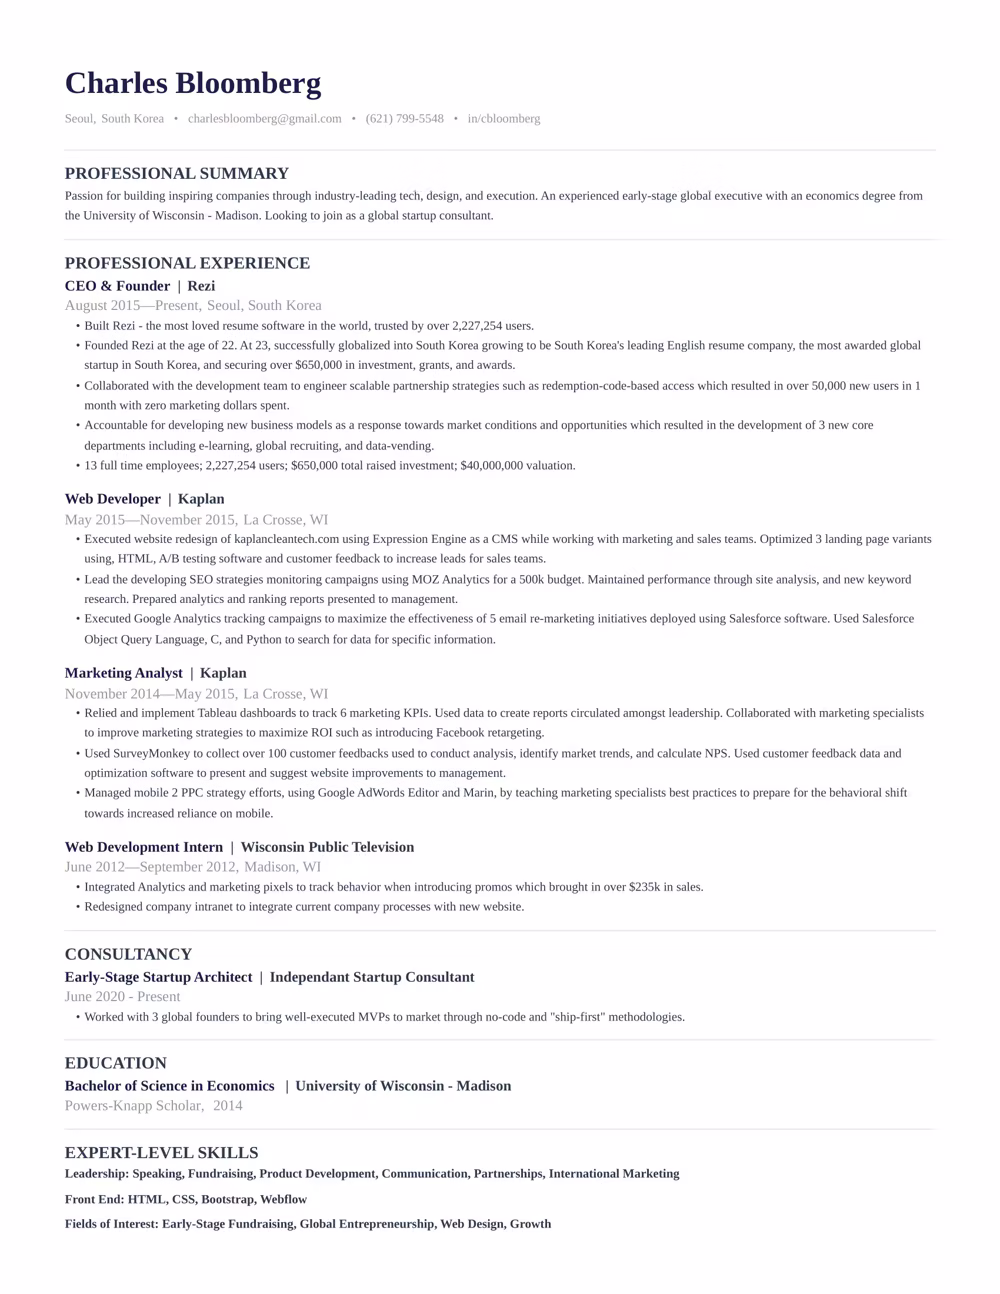
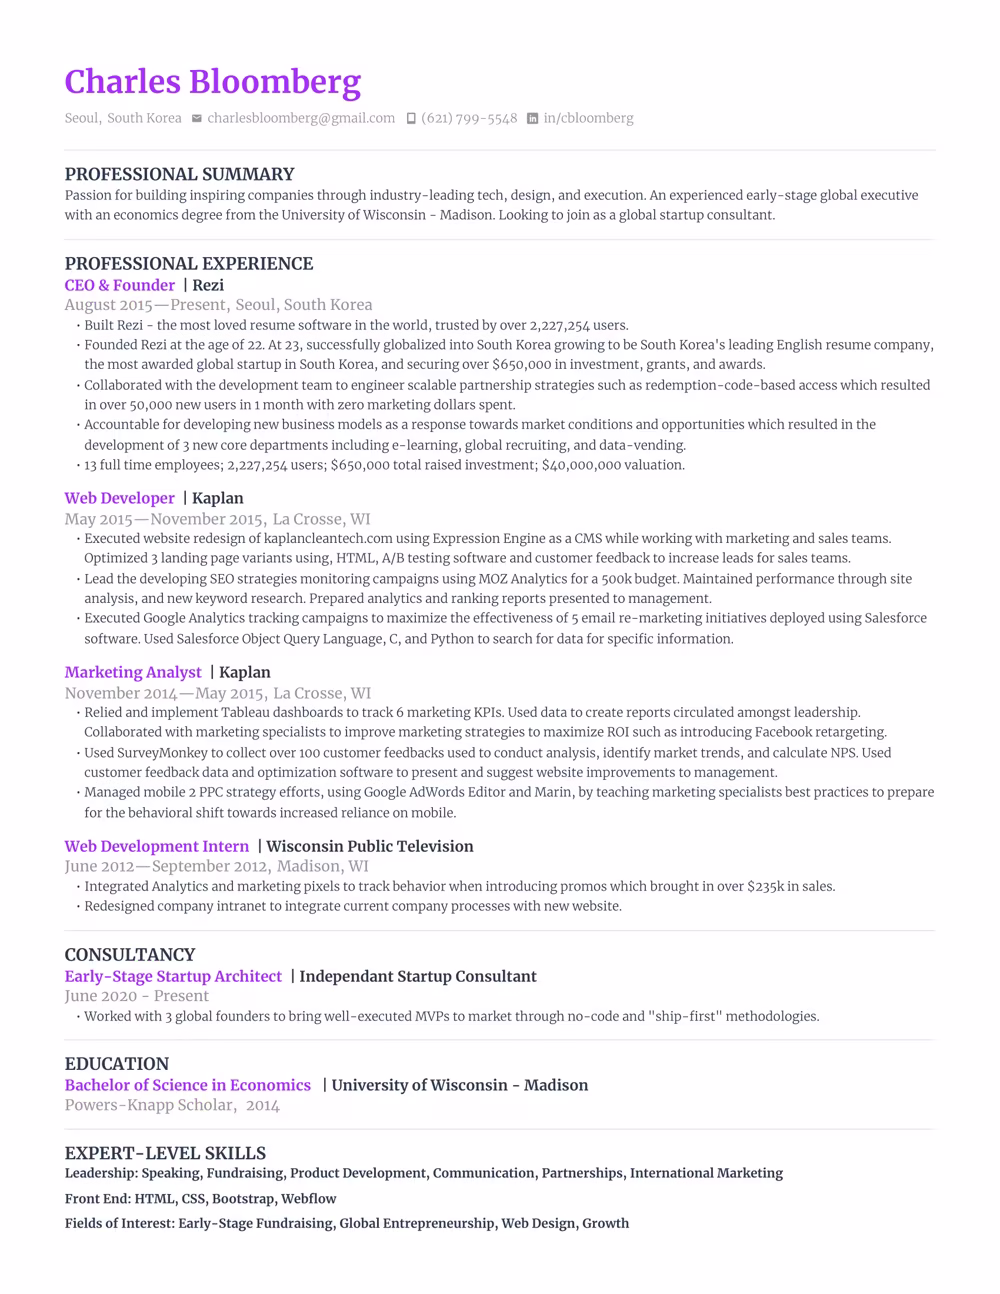
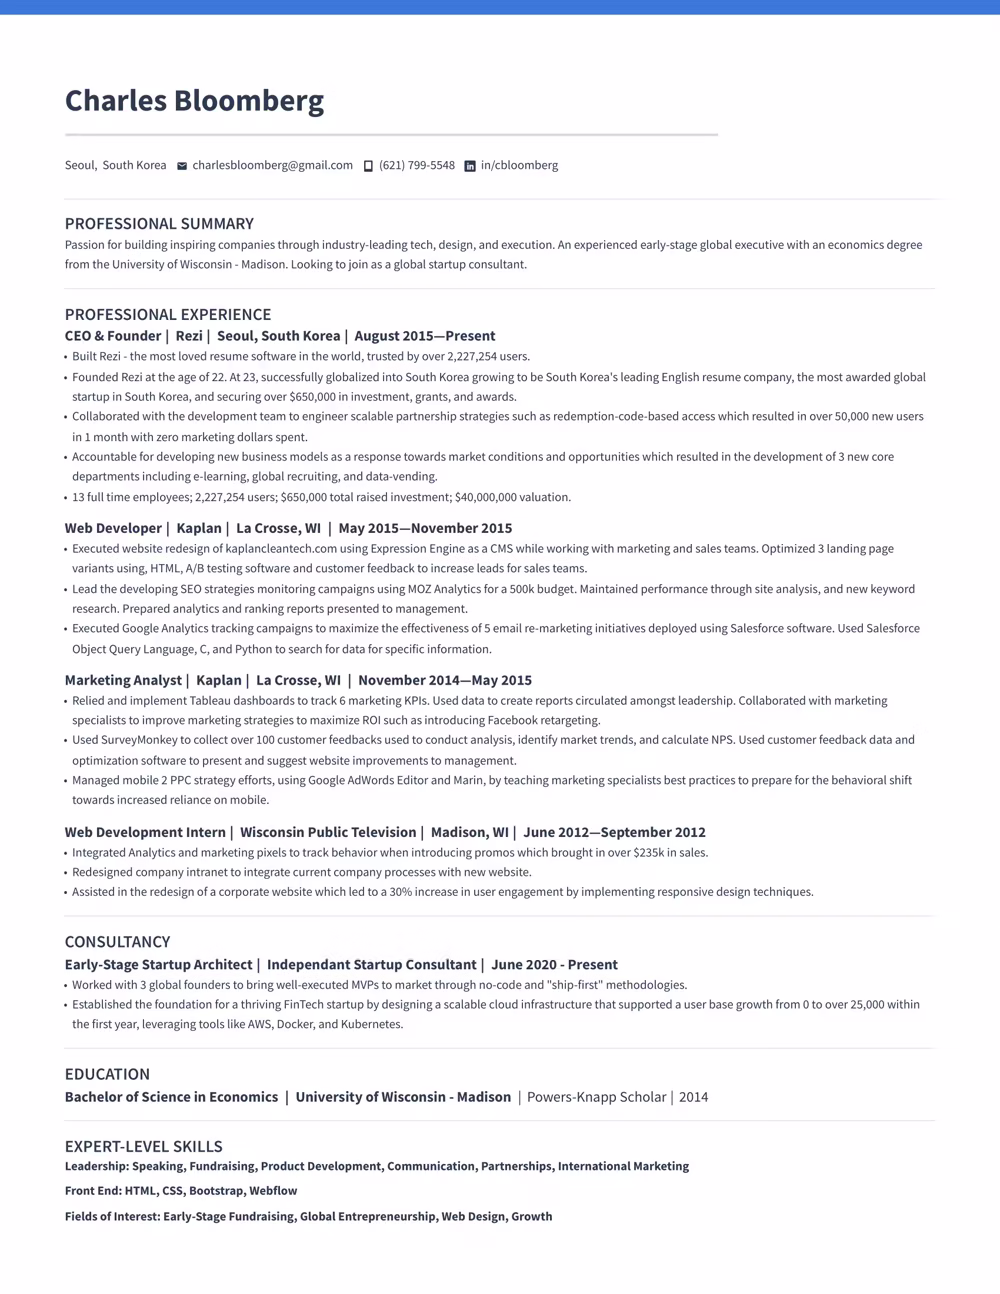
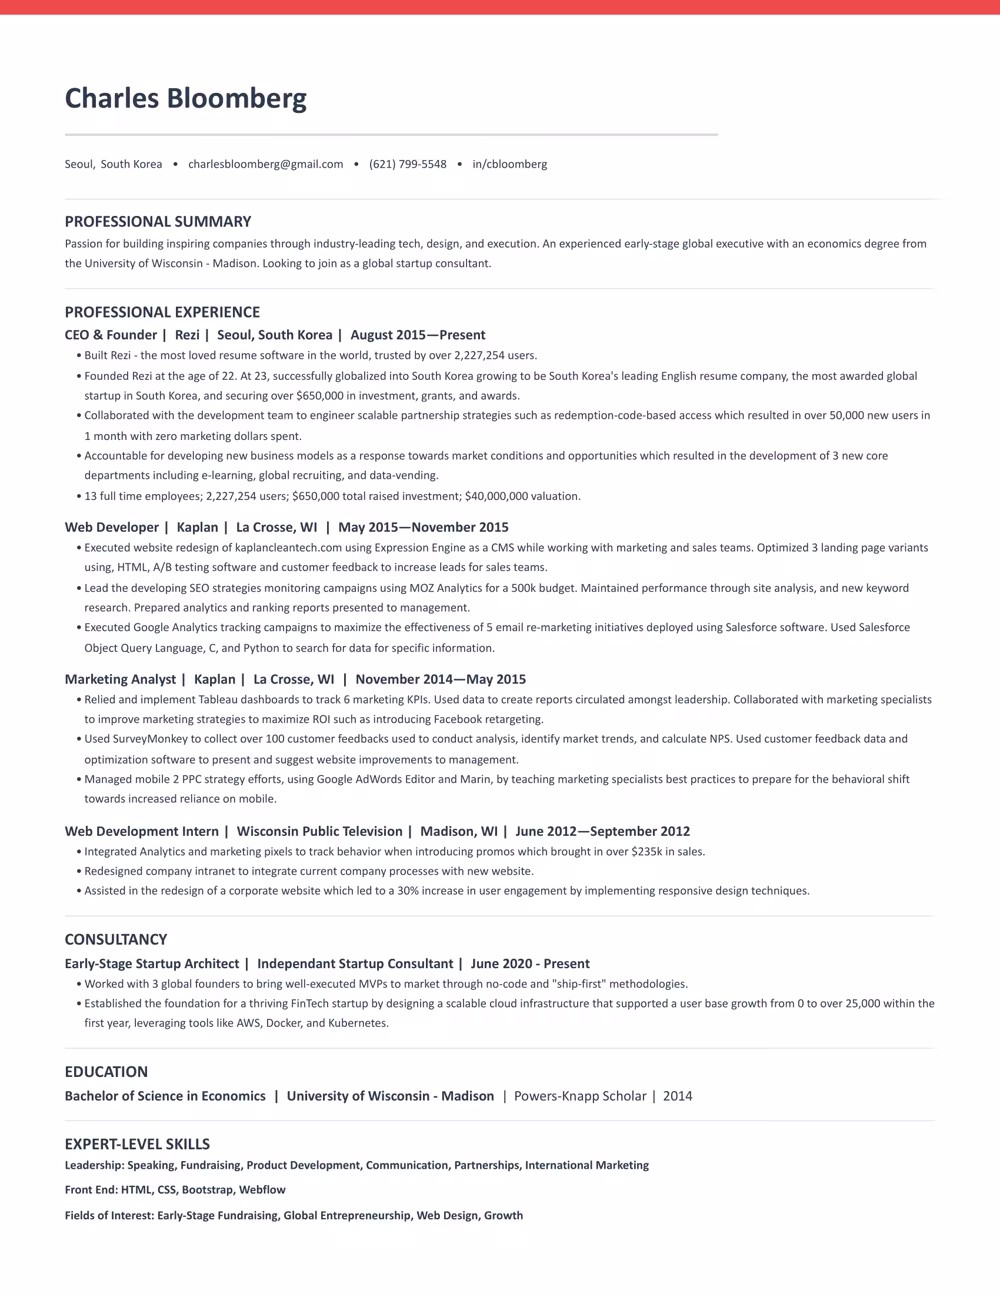
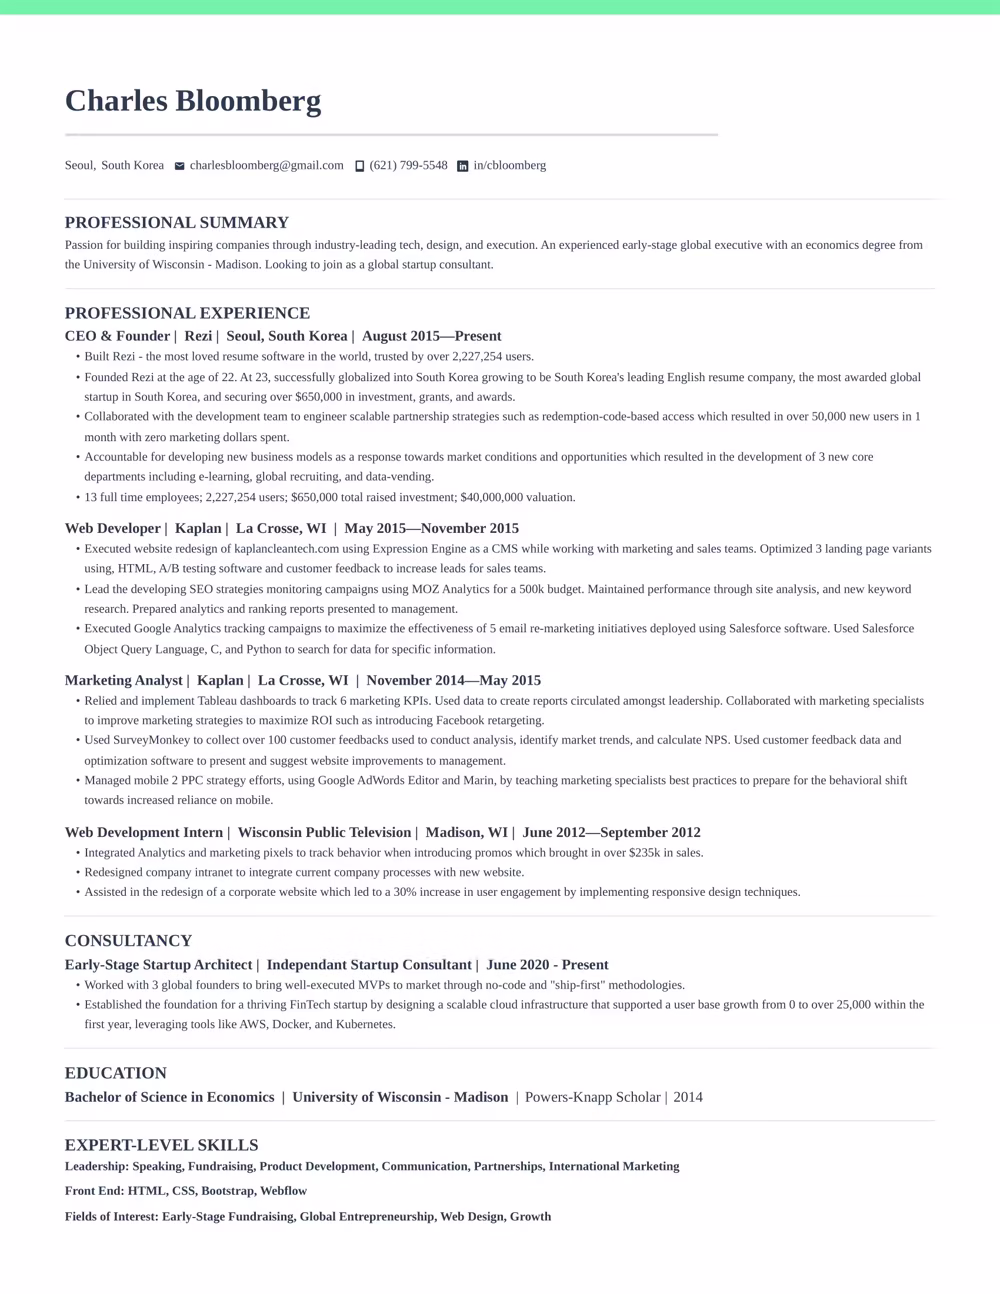
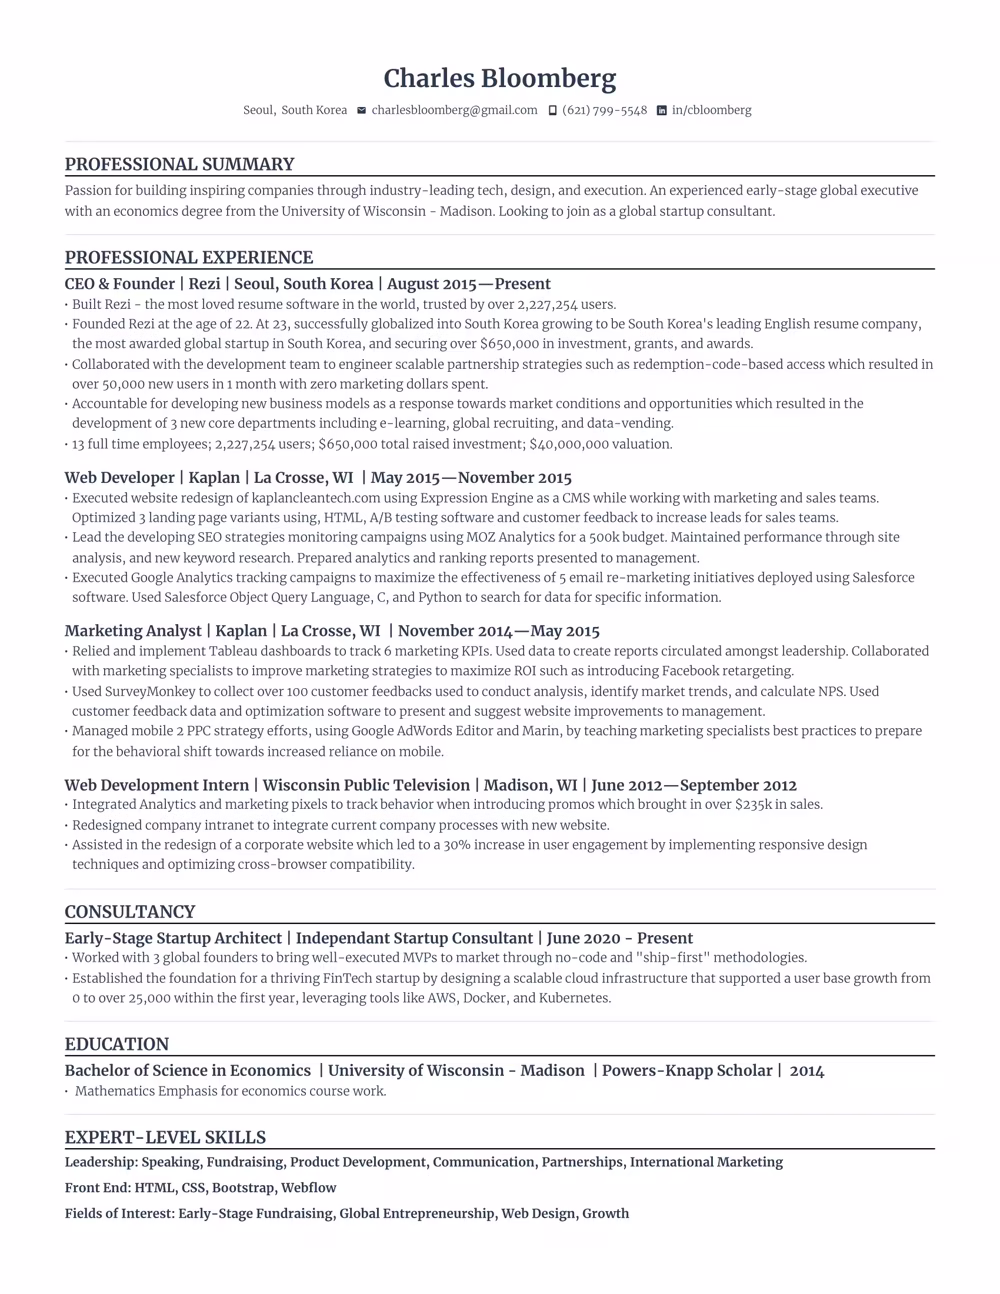
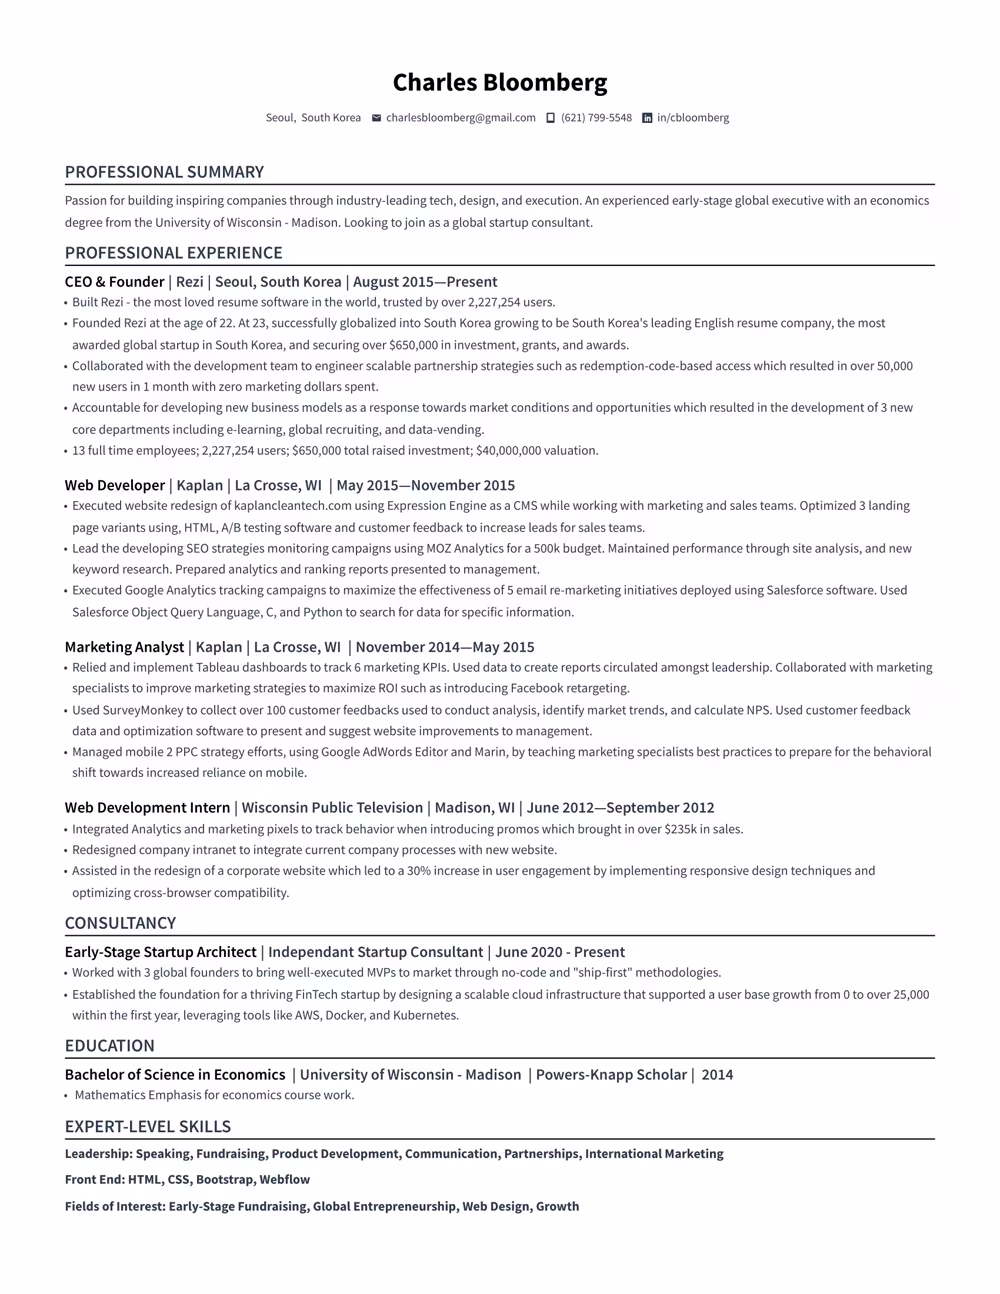
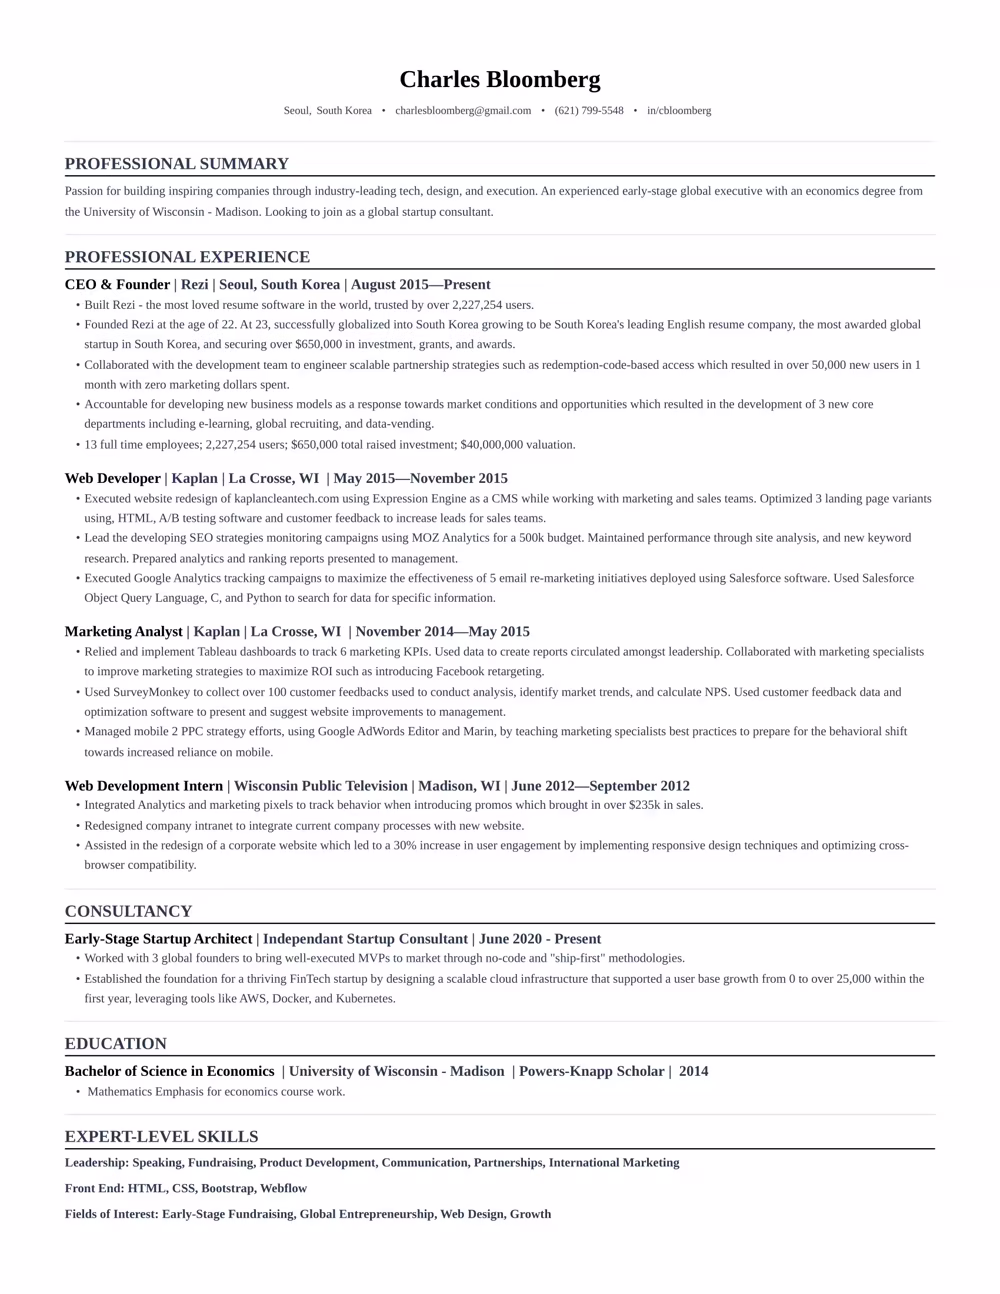
Statistical Analyst Resume
Contents
Resume Formats & Examples
ATS-Friendly resume formats that land jobs
Use a template that guides you. Our ATS-compliant designs are trusted by over 4 million job seekers.


“Rezi is an awesome AI-based resume builder that includes templates to help you design a resume that is sure to check the boxes when it comes to applicant tracking systems. This is a great jumping off point to kickstart a new resume.”

Ashley Stahl
Career Contributor
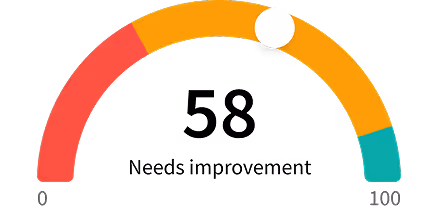
62.18%
Interview Rate
4,510,834
Total Users
8.23 / 10
Avg. User Review
Wall of Love
Over 4 million users trust Rezi

“Resume Building felt like pulling teeth – until I found Rezi.”
Davis Allen
Software Developer

“I was blown away by Rezi. It streamlined everything...”
Celine Watko

“I needed a resume tool as smart as my work.”
Yosra Naceur
Data Scientist
“A great tool that is very helpful. I found the Rezi system easy to use and very helpful as I was working on getting my resume in shape for job applications.”

Dakota Rubin
United States
Written via
“This is actually one of the first reviews I’ve ever written for a business, and that alone says a lot. I highly recommend Rezi to anyone who’s job searching, it makes the entire process so much easier.”

Yazan Alkhatib
United States
Written via
“Reduced my time per application from 1-2 hours down to 15 minutes.”
Kixxx
Experience with Rezi
“I love how simple and convenient it is to use and been coming back to update it every time I need a fresh resume.”

Zara Wazir
U.A.E.
Written via
Frequently Asked Questions
Your questions, answered.
An AI resume maker helps you build a resume perfectly fit for the job you want. Top-notch AI resume builders are designed to speak the language hiring managers are looking for, increasing your chances of standing out in the crowd. It aligns your skills and experience with the job description effectively.
Rezi templates are ATS-safe. Hiring software can parse your resume with accuracy and you won't have to enter the entire resume all over again after uploading it. Our best resume template is always free. More templates and personalisation is available on Pro subscription. Regardless of what resume template you can customise sections to suit your needs. When in doubt, a clean single-column template works for every industry and every applicant tracking system.
To get the most out of an AI resume builder, either start from scratch or upload your current resume. Fill in as much detail as possible about your career and skills, and upload the job description you’re targeting. This personalization allows the AI to build a unique and tailored resume that’s bound to catch potential employers' attention.
Yes. Rezi stores your content separately from the design, so you can switch templates at any time without retyping anything. Your Rezi Score and keyword targeting stay intact across every template. Some advanced resume template formats require a Pro subscription, but our best template is always free.
AI-generated resumes can seem similar if you're not giving personalized inputs or if you're using basic prompts. Provide specific details about your work experience and target the job you’re eyeing. Use specialized AI tools instead of general chatbots to avoid robotic-sounding resumes and to ensure individual creativity.
A Word or Google Docs template is a static file: one wrong edit breaks the formatting, and nothing checks the result. Rezi keeps the layout locked and parser-safe while its AI writes your content, then scores the finished resume against the job you want.
Employers might think you used AI, but that’s rarely an issue. What they really care about is getting a well-written resume that showcases your skills and experiences accurately. A top-notch resume tailored to their needs will speak volumes more than worrying about AI involvement.
No. Recruiters expect a standard structure, and applicant tracking systems parse it more reliably than a hand-built layout. What hurts is generic content. Rezi's AI tailors your bullet points and keywords to each job description, so your resume never reads like a template.
Yes, using AI to optimize your current resume is highly effective. You just need to upload your resume, share details about your career goals and the job you want, and let the AI refine everything to elevate your resume's impact and ATS compatibility.
Rezi uses a tool called the AI Keyword Targeting. This feature scans the job description to identify crucial keywords and naturally incorporates them into your resume, giving it the right focus without keyword stuffing.
The Free plan is $0/month and allows you to create one resume, use limited AI tools (such as Keyword Targeting and Analysis), and download up to three PDFs. You can also create unlimited cover and resignation letters. No card is required to begin.
The Pro plan is $29/month and provides unlimited access to all features, including unlimited resumes, full AI capabilities, unlimited downloads, and one free monthly expert resume review (resumes are reviewed by a person).
The Lifetime plan is a $149 one-time payment. It grants permanent access to all the features of the Pro plan (unlimited resumes, full AI tools, and unlimited downloads), but it does not include the free monthly expert review (which can be purchased for an extra fee).
Yes. The standard template free and available for all users. With the free plan, you can completely create 1 resume, use AI writer, and download your resume 3 times in PDF format. No credit card is required to join the free plan. Rezi Pro at $29 per month removes the limits and unlocks all our Pro templates including Compact, Modern and Smart templates.
Rezi offers a 100% money-back guarantee on all paid plans (Pro and Lifetime). If you are unsatisfied, you can request a full refund within 30 days of your purchase.
The free template that comes with the free plan is rated as one of our best resume templates. Pro subscription offers more personalisation and more templates while keeping ATS-safe designs; Pro removes limits on resumes, downloads, and AI tools. Our best template is never paywalled and is always free for everyone.
Yes, you can easily upgrade or downgrade your plan at any time through your Rezi Account Billing dashboard. Prorated credits will apply when switching.
An AI resume maker helps you build a resume perfectly fit for the job you want. Top-notch AI resume builders are designed to speak the language hiring managers are looking for, increasing your chances of standing out in the crowd. It aligns your skills and experience with the job description effectively.
They are risky. Many parsers read multi-column layouts out of order or skip a column entirely, so skills and dates end up scrambled. You can easily check this in popular ATS like Workday and Lever. Rezi templates will seamlessly populate the fields in these ATS where two-column templates struggle. The same applies for graphical resumes. Rezi uses single-column layouts because they parse correctly in every major applicant tracking system.
Use a text-based PDF unless the job posting asks for Word. PDFs have been around for years and modern applicant tracking systems read PDFs reliably. PDF locks your layout so it looks the same everywhere. Rezi exports machine-readable PDFs that parse cleanly in every major ATS and ensure compatibility.
Yes. The same ATS rules apply to CVs: single column, standard headings, machine-readable text. CVs usually tend to be longer than resumes. You can check their differences here. Rezi templates can handle both if you require a longer CV format, you can easily add sections like publications, certifications, and research without breaking the layout. It is recommended to use a shorter resume format than CVs when applying for jobs, unless mentioned otherwise.
Yes, Rezi Enterprise.